The Risk From Power Lines: How to Sniff the G3 and Prime Data and Detect the Interfere Attack
summary
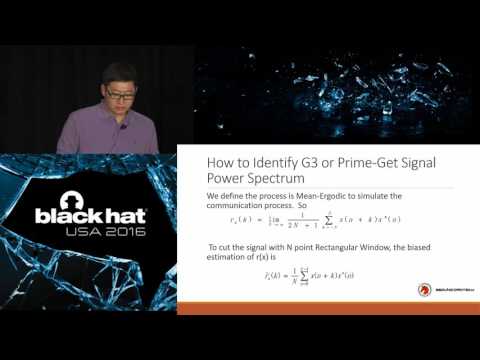
Method to sniff narrow-band PLC (G3 vs Prime) by capturing raw samples, band‑pass filtering, computing autocorrelation → FFT power spectrum, and matching against an ideal OFDM spectrum using normalized cross‑correlation. Target frequency resolution is 0.5 kHz (choose FFT length accordingly, roughly N≈124), and match threshold is cross-correlation >0.9. Continuous jamming is visible in the spectrum; stealthy packetized interference is found by splitting records by symbol length and correlating with MAC timing. Detection approach proves practical on received captures.
AI-written summary · about
chapters (10)
- 0:00Intro
- 1:07Abstract
- 1:50What is PLC?
- 2:49PLC classification
- 4:02G3 and Prime Features
- 7:23How to identify G3 or Prime-Get Signal Power Spectrum
- 10:47How to identify G3 or Prime-Calculate OFDM Power Spectrum
- 12:51How to identify G3 or Prime-Identify G3 or PRIME
- 14:53Modulation and Demodulation structure
- 15:41How to detect the interfere attack
related talks
 47mExfiltrating Reconnaissance Data from Air-Gapped ICS/SCADA Networks
 25mSecurity Analysis of Zigbee Networks with Zigator and GNU Radio
 55mReliable and Secure Embedded Systems
 01h 00mHacking the Wireless World with Software Defined Radio - 2.0
 24mEnhancing Physical Perimeter Defense Using SDR
 26mBack to the Future. Cross-Protocol Attacks in the Era of 5G
 20mMulti-Receiver Real-time Physical Intrusion Detection “Burglar Alarm” with GNU Radio ...
 53mHacking the Wireless World with Software Defined Radio - 2.0