Give yourself time to sleep

summary
Production monitoring stack that scales to >100 projects and 30 servers and handles ~2,000 checks per minute while using only ~10% capacity. Uses Sensu (server, clients, API, Uchiwa dashboard) with RabbitMQ transport and Redis event storage, supports automated remediation scripts that can reboot services. Metrics pipeline is RabbitMQ → Redis for events, Sensu relay → Carbon/Whisper → Grafana for graphs and alerts with configurable retention. Centralized logging uses Graylog with streams and extractors for per-client isolation and alerting. Initial build takes ~3 days, repeat deploys in ~4 hours.
AI-written summary · about
chapters (20)
- 0:00Give yourself time to sleep Painless system monitoring
- 0:47We're an independent design & development agency.
- 3:43SENSU ARCHITECTURE
- 6:41THE GLUE Used for communication with dashboards and external services
- 7:42SENSU DASHBOARD Open-source
- 8:49REALLY POWERFUL and simple
- 10:04SIMPLE CONFIGURATION with advanced features
- 13:34CARBON-CACHE with aggregation and relays
- 14:33CONFIGS CONFIGS CONFIGS just the way you like it
- 15:21WHISPER DATABASE
- 16:19DATA AGGREGATION
- 17:40RELIES ON GRAPHITE WEB Unfortunately
- 17:53BEAUTIFUL METRICS and graphing
- 18:18SUPPORT FOR TEMPLATING Easily switch between servers
- 18:37MULTI-USER SUPPORT And multiple organisations too!
- 20:07CENTRALIZED LOGGING
- 20:46SEARCH And charts, everyone loves charts
- 20:56EASY-TO-USE FRONTED
- 23:39INPUTS Data entry point
- 26:08NOTIFICATIONS
related talks
 45mDecentralizing SaaS Monitoring Using Open-Source Tools and Standards
 39mKeeping the lights on: Application monitoring with Sensu and BatsD
 20mUsing Monitoring to Speed Up Your DevOps Journey
 29m“If you Don’t Monitor your Infrastructure, you Don’t Own it!” Regain Control Thanks to Prometheus
 34mEfficient Resource Management
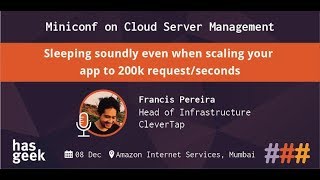 24mSleeping soundly even when scaling your app to 200k request/seconds
 56mGetting all the 99.99(9) you always wanted
 46mMonitoring with Sensu 2.0