Storytelling in the Age of Big Data
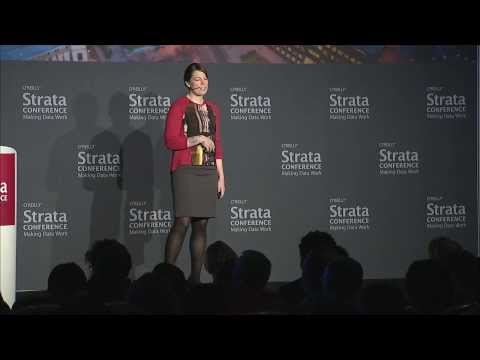
summary
Argues that storytelling and data alternate as drivers of discovery, citing Copernicus overturning geocentric epicycle math, Wolfgang Pauli neutrino predicted in 1930, observed two decades later, and John Snow mapping cholera to a Broad Street pump. Shows how visualization choices reshape interpretation with opposing ACA charts, and highlights applied analytics like Jeffrey Brenner’s hot spotting reduces readmissions 40–50%. Emphasizes building bridges from analysis to action using mapping, statistical models and clear visual narratives.
AI-written summary · about
chapters (8)
- 0:00Context and time scale
- 1:04The role of stories
- 2:35Data and scientific history
- 4:45Discoveries through data
- 6:18Visual storytelling
- 7:36Interpretations and bias
- 9:25Data science as action
- 10:43Writing the future
related talks
 24mStorytelling with data
 38mThe Art of Telling Stories with Data
 30mData Storytelling through Visualization
 40mData Visualization for Humans
 31mData Storytelling through Visualization
 24mStorytelling With Data
 11mData Visualization & Storytelling
 51mStories Beat Statistics: Master the Art & Science of Data Storytelling