Art.js: Transfigure Data to Create 21st Century Art
summary
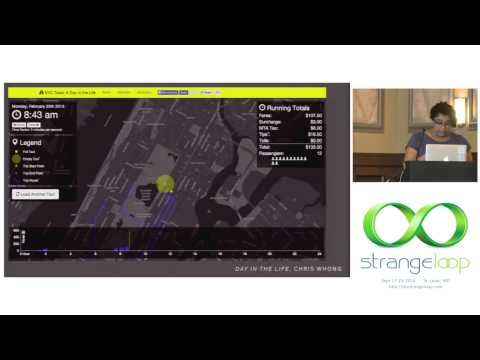
Claims that data-as-art communicates experience not just facts and shows how to make it with concrete tools: JavaScript, d3,js, Mapbox/Leaflet and Node. Examples include First Chapters (sentence-length visuals), taxi replay using Mapbox/Leaflet and Node that yields believable driver stories, Laurie Frick’s Nightly Sleep Analyzed and Quantified Breakup as personal datasets, Patatap and a patent generator for playful translation. Process notes include sketching, imperfect CSV data, iterative testing, and several successful web builds.
AI-written summary · about
chapters (9)
- 0:00Introduction to data art
- 2:12Data art vs. visualization
- 6:41Motivations for making art
- 12:04Risks and rewards
- 14:28The literary approach
- 22:44Language as data
- 26:55Getting started
- 29:16The creative process
- 33:14Q&A and conclusion
related talks
 26m"Where Numbers Meet Art: Building Data Visualizations In The Modern Web"
 47mData, Design, Code
 37mPainting with Data
 01h 12mArtist Keynote
 33mPainting with Data
 19mThe Art of Data: Hand-crafted, Human-centered Dat...
 14mThe Art of Data
 48mVisual Storytelling w/D3-A Conceptual Intro to Visualizing Data w/JavaScript