Dev Team Metrics that Matter

summary
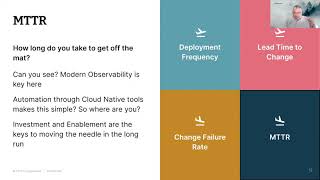
Dora’s four metrics are given with concrete benchmarks: elite cycle time < 1 hour, high 1 day–1 week, medium 1 month–6 months; deployment frequency, change failure rate (elite 0–15%), and MTTR. LinearB adds a measurable PR-size effect: PRs under 200 lines merge twice as fast (100 lines ≈ 2 days, 500 ≈ 5 days). Practical tooling shown includes PR enrichment (estimated review time, diff snapshot), Slack notifications, inline approve and an upcoming GitStream rules engine for automated assign/merge (early beta).
AI-written summary · about
chapters (10)
- 0:00Introduction and background
- 1:49DORA metrics overview
- 3:11Cycle time explained
- 5:43Deployment frequency
- 6:29Change failure rate
- 7:12Mean time to restore
- 7:58PR size importance
- 11:11Continuous merge concept
- 12:55Automating PR workflows
- 14:38Q&A and closing
related talks
 39mDev Team Metrics that Matter
 22mDev Team Metrics that Matter
 22mDORA Metrics: The Key to DevOps Excellence
 44mEnhancing the Performance of Engineering Teams
 14mI don't think these metrics mean what you think they mean!
 29mA DORA Metrics Adventure in Deciphering Engineering Changes
 30mDevEx and Productivity Metrics on Backstage - Do's and Don'ts
 45mOne Metric to Rule them All: Cycle Time