What it means to be Just In Time

summary
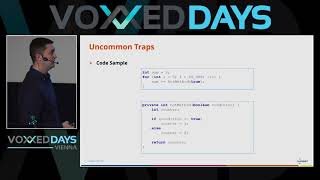
Explains what the JVM actually does: JIT chooses hot methods and applies method inlining and dead‑code elimination; uses JMH microbenchmarks and JVM flags (-XX:+PrintCompilation, -XX:+PrintInlining, PrintAssembly) plus JITWatch and the HotSpot disassembler to verify optimizations. Shows escape analysis removing heap allocations (0 GC vs ~5,500 GC events, ~2ns vs ~5.5ns), polymorphism cost when 3+ types raises per‑call latency (~5.5ns→~8ns), and safepoint pauses from array copies jumping to ~62ms. Provides concrete flags and measurements to reproduce.
AI-written summary · about
chapters (11)
- 0:00Introduction to JIT
- 1:13JIT vs static compilation
- 3:44JVM interpreter and profiling
- 7:37Verifying JIT with JMH
- 11:55Debugging JIT optimizations
- 16:30Inlining optimization
- 20:45Dead code elimination
- 27:40Escape analysis
- 31:20Polymorphism optimization
- 39:24Safe points in JVM
- 51:59Summary and key takeaways
related talks
 59mAn Introduction to JVM Performance
 01h 01mAn Introduction to JVM Performance
 41mAn Introduction to JVM Performance
 44mJIT Me Baby One More Time
 49mAn Introduction to JVM Performance
 35mJava at Speed: Building a Better JVM
 54mJava performance techniques The cost of HotSpot runtime optimizations
 01h 09mFrom Bytecode to Native Code in HotSpot JVM