I Can See Clearly Now: Observability of JVM & Spring Boot 2-3-4 apps
summary
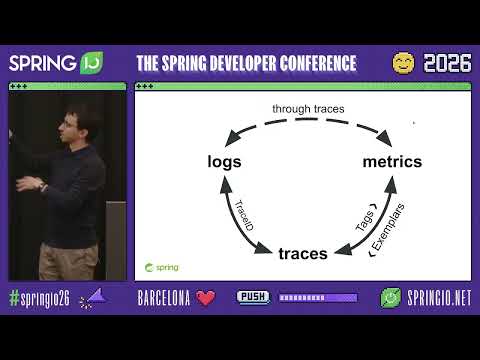
Example-driven demo uses the Tea House app from the GitHub repo and shows a real failure chain: metrics reveal ~0.5 errors of 4.5 RPS (~10%), distributed traces show a downstream JDBC query returning zero rows, a 404 being remapped to a 500, and the fix restores success. Setup details include Micrometer (observation API + handlers), Micrometer Tracing (Brave or OpenTelemetry), Grafana + Prometheus + Tempo/Zipkin, JDBC/HikariCP details, and exemplar-powered metric→trace linking.
AI-written summary · about
chapters (10)
- 0:00Introduction
- 1:09What is observability and why it matters
- 4:17Debugging live demo
- 17:05Logging setup Spring Boot
- 21:58Metrics with Micrometer
- 25:26Distributed tracing Micrometer
- 32:06Observation API
- 38:28Spring Boot 4 Micrometer
- 44:53Spring Boot 4 features
- 46:59Q&A
related talks
 45mObservability for Modern Spring Applications
 48mObservability of Your Application
 52mIs your JVM app flying blind? Unmask hidden issues with Observability superpowers!
 59mTo Production and Beyond: Observability for Modern Spring Aps
 58mObservability Beyond the three pillars with Spring
 38mObservability 101 with Spring and Micrometer
 53mUnmask hidden issues with Observability superpowers!
 46mImplementing Observability in Java-Based Projects