How to Create Truly Great Charts

summary
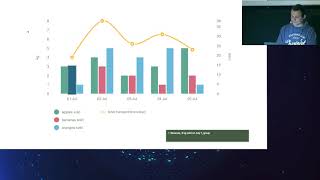
Argues that good charts must "do the job" and require many skills beyond tool fluency: data sourcing/cleaning, basic statistics, situational knowledge, design and sometimes coding; claims about 50 chart types and a 14‑hour course illustrate depth. Offers a decision tree for time series and concrete rules: use a step chart for irregular persistent prices, a bumps chart for rank changes, a dot plot when most dates are missing, and thin bars for individual transactions; shows how slope/arrow charts can mislead on absolute vs relative change.
AI-written summary · about
chapters (4)
- 0:00Defining effective charts
- 3:41Essential chart-making skills
- 15:11Workshop on data over time
- 30:23Takeaways and Q&A