Leveling up your Grafana Skills
summary
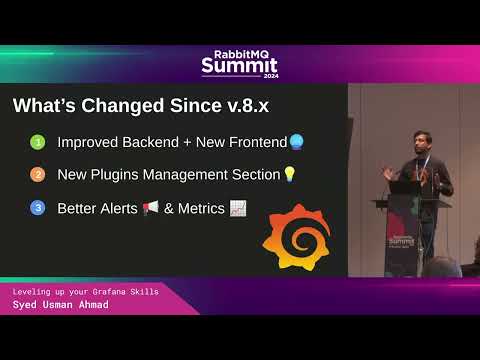
Shows a live Prometheus+Grafana setup that queries RabbitMQ metrics, demonstrates importing community dashboards and a dedicated RabbitMQ plugin, and warns that Grafana v8 is unsupported while v9–v11 change the frontend so many old plugins break. Demonstrates a new Metrics Explorer with auto-query suggestions (released within weeks) and a Matrix catalog to drop Prometheus metrics onto panels. Proves public dashboards can be shared without auth and configures alerting contact points to Slack, Teams, Discord, PagerDuty, Telegram, AWS, plus runbook links.
AI-written summary · about
chapters (9)
- 0:00Introduction and background
- 1:24RabbitMQ observability needs
- 2:47Grafana overview and demo
- 4:22Platform features and sharing
- 7:48Metrics and query building
- 11:36Alerting and integrations
- 14:37Full observability stack
- 16:58Community and plugins
- 19:13Conclusion and engagement
related talks
 40mPrometheus for Devs
- 40mPrometheus for Devs
 32mGrafana 11 deep dive
 34mPrometheus for Devs
 32mDemocratizing Application Monitoring with Prometheus
 48mMetrics All the Way: Data Driven Operations
 24mFrom Monitoring to Observability: 10 Things to Do with Prometheus in 2020
 20mThe Evolution of Grafana Alerting