From Monitoring to Observability: 10 Things to Do with Prometheus in 2020

summary
Practical, concrete guidance for using Prometheus to move from simple monitoring to observability: deploy Prometheus and node_exporter (on dedicated nodes), expect about 30 days retention by default, and offload long-term metrics using agents like Glouton or a long-term store such as Thanos/Square’s store. Use Grafana marketplace dashboards, keep labels low-cardinality, write PromQL for combined alerts, create metrics from logs with promtail or mtail, and route alerts via Alertmanager to OpsGenie/VictorOps.
AI-written summary · about
chapters (13)
- 0:00Intro
- 0:32About observability
- 2:06s/monitoring/observability
- 4:16Deploy Prometheus Prometheus became standard de facto
- 5:34System Monitoring
- 7:02Use (and abuse) of exporters
- 8:57Configure your labels (properly) Labels are a way to tag a metro
- 11:04Add metrics in your code
- 12:47Configure Grafana Gradara is an easy dashboard to be deployed -Dashboard marketplace is available for standard dashboard
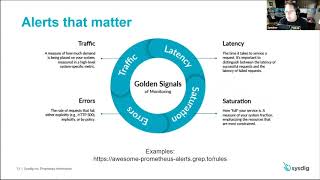
- 14:46Configure Alert Manager
- 18:08Send logs (metrics) to Prometheus
- 19:29Learn PromQL
- 21:33Don't underestimate the load
related talks
 31mEvolution of Metric Monitoring and Alerting: Upgrade Your Prometheus Today
 32mDemocratizing Application Monitoring with Prometheus
 41mSo Many Metrics, So Little Time: 5 Prometheus Exporter Best Practices
 24mPractical Kubernetes Monitoring with Prometheus
 50mMetrics and alerting with Prometheus and Grafana
 10mPrometheus for Monitoring Metrics - Database Monitoring Tools
 27mObservability with Prometheus and beyond
 35mDoing Things Prometheus Can’t Do with Prometheus