Practical Kubernetes Monitoring with Prometheus

summary
Deploys a ready-to-run monitoring platform using kube-prometheus stack (Prometheus, Alertmanager, Grafana, node-exporter, kube-state-metrics, cAdvisor) and shows how to add app metrics via the ServiceMonitor CRD. Claims a five-minute success to get dashboards and alerts, demonstrates a demo app with three replicas, two scraped, one unknown, and recommends in-cluster Prometheus, port-forward/ingress for UIs, jsonnet for custom rules/dashboards, remote_write to Thanos/Cortex, and moving from metrics to logs/traces (Loki/Tempo/OpenTelemetry).
AI-written summary · about
chapters (26)
- 0:00Intro
- 0:39Microservices and classic host/services models
- 1:09Thoughts and tips
- 2:34Prometheus inside Kubernetes?
- 3:48Prometheus: Architecture
- 5:10Prometheus Terminology: Service Discovery
- 5:44Overview: kube-prometheus
- 7:14Install kube-prometheus & Prometheus Operator
- 7:26Familiarize yourself with the deployment
- 8:10Alert Manager UI
- 8:29Grafana dashboards
- 9:21Deploy the demo app prometheus_demo_service
- 10:03Monitor the Demo Service
- 10:29Verify Prometheus Service Monitor targets
- 11:51kube-state-metrics
- 12:38Customize kube-prometheus
- 13:26Golden Signals
- 15:34Alert Rules in Prometheus Operator
- 16:10SLA, SLO, SLI
- 16:53SLOs as code
- 17:51SLOs with Prometheus
- 20:49Profiling
- 21:05Infrastructure as Code, GitOps and Monitoring
- 21:34Kubernetes Security Monitoring
- 22:02RBAC & Policies
- 22:52Resources: Workshops and Trainings
related talks
 37mMonitoring Kubernetes with Prometheus
 02h 43mPrometheus from A to Z
 19mKeynote: Monitoring Kubernetes Clusters with Prometheus
 30mCrash course in Kubernetes monitoring
 32mDemocratizing Application Monitoring with Prometheus
 37mKubernetes, Monitoring with Prometheus and Grafana
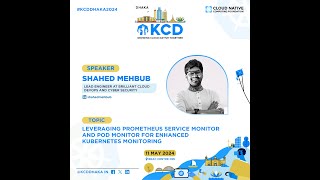 46mLeveraging Prometheus Service Monitor and Pod Monitor for Enhanced Kubernetes Monitoring
 14mFrom Metrics to Mastery: Monitoring vital signs of Kubernetes