Words in Space

summary
Visual diagnostics show specific, actionable differences: using Yellowbrick and scikit‑learn with SciPy metrics (Euclidean, Manhattan, Minkowski, Jaccard, Cosine) and stochastic neighbor embedding quickly reveals when classes become separable or remain diffuse. Examples include Chebyshev improving one corpus and Mahalanobis producing a distinctive “kidney” separation, token frequency and dispersion plots expose the exact n‑grams driving clusters, and an inter‑cluster map confirms chosen K. Code is cheap to run and the visualizers demonstrably work.
AI-written summary · about
chapters (9)
- 0:00Introduction
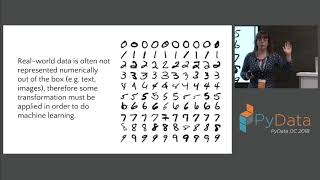
- 2:12Feature space ML
- 6:15Non-numeric to numbers
- 8:23Distance measures for text
- 12:36Visualizing text
- 15:24T-SNE distance comparisons
- 20:45Right distance measure
- 22:31Yellowbrick pipeline
- 26:07Yellowbrick & open source
related talks
 45mWords in Space: A Visual Exploration of Distance, Documents, and Distributions...
 39mVisual diagnostics for more informed machine learning
 35mUsing Scattertext and the Python NLP Ecosystem for Text Visualization
 34mDimensionally reducing data squeezing out the good stuff
 40mTools and Tricks from a Pragmatic Data Scientist
 26mAI at Stitch Fix
 25mThe Art of Clustering: The Good, The Bad and The Beautiful
 51mArt of Effective Visualization of Multi-dimensional Data