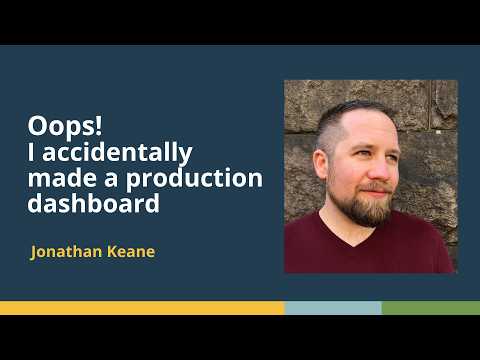
Oops! I accidentally made a production dashboard
summary
A dashboard built as a prototype becomes a daily operational tool when executives actually open it every morning, so usage telemetry is the trigger that forces production work. The stack described includes ShinyTelemetry for event logging, Posit Connect’s built‑in usage dashboard and optional Google Analytics for static Quarto pages, plus CI with GitHub Actions and Dependabot PRs to keep dependencies current. Emphasis on modular code and small, testable functions proves practical and effective.
AI-written summary · about
chapters (8)
- 0:00Accidental to production dashboard
- 2:06Detecting production usage
- 5:00Balancing success and chaos
- 6:04Modularity and testing
- 9:40Continuous integration
- 11:29Managing dependencies
- 13:19Tools to turn oops into yay
- 14:27Q&A
related talks
 36mIt's not in Production Unless it's Monitored
 29mImproving Developer Experience with LiveDashboard
 45mA Practical Guide to Dashboarding
 34mMetrics driven development
 48mAPI Observability by Design: Building Systems That Tell Their Own Stories
 21mJourney from Broken Dashboards to O11y Maturity
 40mGrowing internal tooling from the console up
 45mCreating & Maintaining Impactful Dashboards'