PNSQC 2013 - Michael Mah
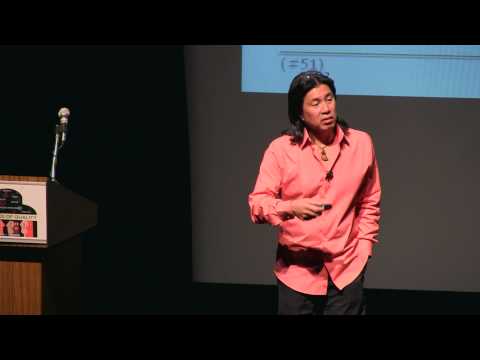
summary
Claims measured against a 12,000‑project QSM library and the SLIM model show collocated small teams, pair programming, and acceptance test–driven development shrink the defect curve and speed delivery. Example: one education company cuts QA defects ~50–60% and halves schedule; a large BMC release delivers in ~6.3 months with 635 QA defects using ~92 engineers instead of an expected multi‑thousand defect count and 15‑month schedule. The methods are quantifiable and reproducible.
AI-written summary · about
chapters (20)
- 0:00Start
- 5:47Rayleigh Curve Defect Rate
- 18:07The QSM SLIM Database
- 19:59Background
- 22:05Agile Captures the Right Metrics for SLIM
- 23:13Agile vs Waterfall - Schedule
- 26:26Agile vs Waterfall - Quality
- 30:02Case Study: Co-Located XP - Follett Software
- 35:08Trendline Assessment - Defects/Quality
- 38:21Trendline Assessment - Build Phase Schedule
- 38:39Follett vs. Industry Average
- 43:00Project Sketch - Core Metrics
- 46:15Agile Assessment - Schedule
- 46:44Agile Assessment - Quality
- 47:53Short Feedback Loops
- 49:40Avoiding Burnout
- 50:52Craftsmanship Over Craft
- 54:43Transparency
- 57:04Sample Agile Release Summary
- 59:11Speed - Columbus
related talks
 46mPNSQC 2014 - Jeana McClure
 55mAgile Engineering
 40mReal Quality Assurance from an Agile and Lean Viewpoint
 37mBest Practices for Accelerating Delivery
 26mHelp! We have a QA problem
 41mLean QA: Much more cost-effective Quality Assurance methods, than testing
 42mPNSQC 2014 - Karen Johnson
 49mOptimizing QA Flow to Minimize Time to Release While Meeting Quality Standards