GC Tuning Confessions of a Performance Engineer

summary
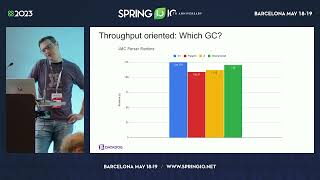
Shows hands‑on comparisons of Parallel Old, CMS and G1 with concrete failure modes and fixes: one workload logs 40,000 GC events with a single 20.699s max pause caused by five full GCs and ten evacuation failures; CMS gives fast in‑place reclamation but risks fragmentation and promotion failures; G1 uses regional heaps, treats large allocations as humongous objects, aims for G1 targets 90% throughput and incremental mixed collections, and needs tuning of region size, marking thresholds, concurrent threads and reserve percent to avoid evacuation/full GCs.
AI-written summary · about
chapters (10)
- 0:00Intro
- 2:23Performance Engineering - Response Time Metrics
- 6:28Insight Into Garbage Collectors (GCs)
- 8:45GC Algorithms in OpenJDK
- 18:16The CMS Collector
- 24:28The Garbage First Collector
- 39:47What have we learned so far?
- 44:44GC Tunables - The Throughput Collector
- 46:48GC Tunables - The G1 Collector
- 54:17Further Reading
related talks
 47mTuning G1G
 44mMastering GC: tame the beast and make it your best ally
 39mG1GC Concepts and Performance Tuning
 52mGC Tuning & Troubleshooting Crash Course
 31mDemystifying G1GC
 46mMastering GC: tame the beast and make it your best ally
 45mJava Garbage Collectors’ Current Performance Impact
 47mGarbage First Garbage Collector