Mastering GC: tame the beast and make it your best ally

summary
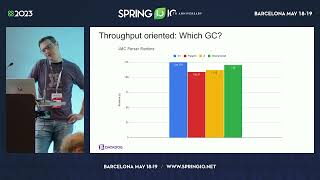
Compares GCs by running JFR traces through JDK Mission Control and a file-processing benchmark that processes many trace files; tests G1, Parallel, ZGC, Shenandoah and C4 and reports concrete metrics: G1 spends ~85% application time (avg pause ~76 ms, max ~197 ms) while Parallel hits ~97% throughput (avg pause ~25 ms, max ~82 ms). Identifies JDK Flight Recorder + JMC as the toolchain, blames humongous allocations and region sizing for G1 slowdowns, and shows tuning (bigger young gen or region size) cuts runtime to ~64s; recommends 97% throughput Par for batch work and ZGC/Shenandoah/C4 for low-latency services.
AI-written summary · about
chapters (15)
- 0:00Introduction
- 1:37Serial GC explained
- 5:54Parallel GC overview
- 8:29Remember sets in GC
- 9:54G1 GC deep dive
- 14:12Low latency GCs
- 16:02ZGC generational mode
- 17:32Selecting the right GC
- 19:00Benchmarking GC performance
- 25:04Tuning Serial GC
- 27:26Tuning G1 GC
- 34:17Tuning Shenandoah and ZGC
- 37:14Choosing GC by workload
- 38:16Why avoid G1 GC
- 40:50Q&A session
related talks
 44mMastering GC: tame the beast and make it your best ally
 39mG1GC Concepts and Performance Tuning
 52mGC Tuning & Troubleshooting Crash Course
 44mGarbage Collector: How to Tame the Beast and Make It Your Best Ally
 53mCalibrate Garbage Collection on the Ground and Run Your Java App
 48mZGC: A Decade of Redefining Java Performance
 31mDemystifying G1GC
 25mGarbage Collection Primer