VMware monitoring with ease
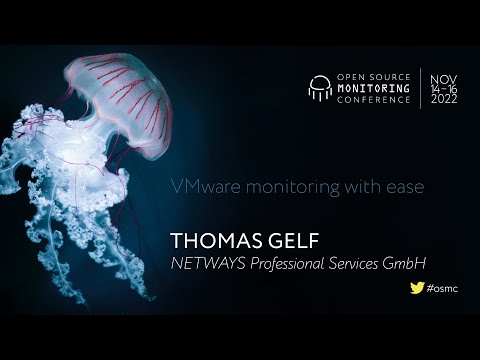
summary
Module claims automated, hierarchical VM checks driven by monitoring rules, exporting results and performance metrics to InfluxDB integration and the Icinga Director. It supports VMware 5.5–8, polls thousands of VMs asynchronously, and uses a rewritten vSphereDB daemon with a database writer subprocess to avoid overload. Examples: snapshot age and count thresholds, uptime warnings (30/100 days), disk free percent vs absolute bytes, and per-folder rule inheritance that deploys concrete Icinga services by UUID.
AI-written summary · about
chapters (9)
- 0:00Introduction and setup
- 1:25Module history and background
- 8:31Development and early versions
- 13:28Major updates and features
- 21:56Live demo and UI overview
- 33:55Monitoring rules and configuration
- 43:12Director integration and sync
- 50:36Performance data and InfluxDB
- 52:20Q&A session
related talks
 01h 05mCurrent State of Icinga
 27mMonitoring at Scale with Icinga
 22mData Mining vSphere with PowerCLI
 29mHow Companies use Icinga
 44mOptimize Kubernetes on vSphere with Event-Driven Automation
 01h 00mDAING - A monitoring stack for datacentres
 42mPowerCLI: How to Automate Your VMWare Environment Reports
 43mWindows Monitoring 3.0 – Now more than ever!