Query Performance Analysis in ClickHouse

summary
Covers diagnosing slow ClickHouse queries by showing where to look in execution plans and resource usage. Describes techniques and tools to analyze whether a query uses CPU, memory, or I/O efficiently and how to find optimizations to speed it up.
AI-written summary · about
chapters (16)
- 0:00Introduction
- 2:16System resources usage
- 5:41CPU analysis and optimization
- 10:39CPU bottlenecks and frequency
- 14:21Performance analysis with perf
- 14:42Disk usage and optimization
- 23:12Memory myths and reality
- 25:18Network common issues
- 26:44Diagnostic tools
- 31:42ClickHouse query monitoring
- 33:30Past issue analysis
- 34:13Query tracing
- 37:01Query execution metrics
- 40:23Query optimization example
- 44:54Flow analysis with tprof
- 47:49Q&A
related talks
 42mOptimizing ClickHouse query performance
 59mEffective Use of ClickHouse
 37mFinding Bottlenecks in ClickHouse: Profiling, Heatmaps & Flamegraphs
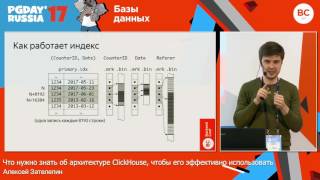 51mWhat You Need to Know About ClickHouse Architecture
 49mSolving real business cases with ClickHouse
 42mTips & Tricks to Keep Your Queries under 100ms with ClickHouse®
 50mQuery Analysis in MySQL, PostgreSQL, MongoDB
 51mTheory and practice of using ClickHouse in real applications