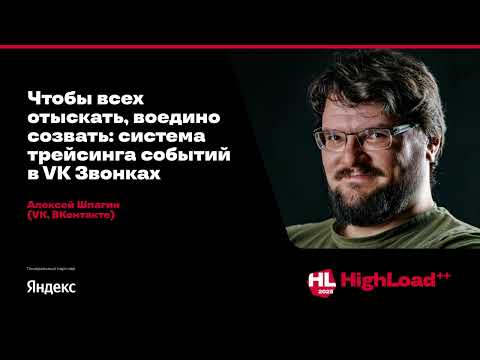
To Find Everyone and Bring Them Together: Event Tracing System in VK Calls
summary
VK Calls implemented an event tracing system to diagnose call issues like failed connections, dropouts, and missing screen sharing. The system collects and links call events and traces across components to make root-cause investigation practical instead of manual, ad-hoc searching.
AI-written summary · about
chapters (13)
- 0:00Introduction
- 1:50VK Calls user support issues
- 7:06Tracing system reasons
- 9:15Palandir requirements
- 10:40Palandir architecture
- 14:55Palandir interface
- 17:30Data types and events
- 18:57Data volume and load
- 20:01Palandir implementation results
- 21:03Case analysis before/after
- 27:18System development plans
- 30:28Summary and advantages
- 31:53Q&A
related talks
 54mEverything Everywhere at Once: Tracing under High Load with 10k Backends
 01h 30mIntroducing CallTracing(tm), based on RabbitMQ, Spring and Zipkin
 39mTracing VMs Seeing How Host and Guest Interact
 44mTracer — an Alternative to Crashlytics. A Different Take on App Error Analytics
 57mDistributed Tracing: How the Pros Debug Concurrent and Distributed Systems
 53mFrom Algorithm to Production: How to Approach Verification of Distributed Systems
 01h 00mBuilding your own profiling and diagnosis tools with Event Tracing for Windows
 07mWhy Tracing is a Lifesaver for E2E Tests of Distributed Systems?