From field to screen: Designing for real-time conservation impact

summary
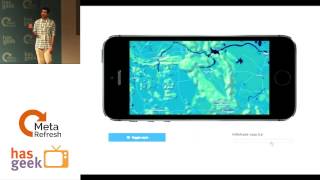
Two production platforms: Skylight (web) monitors 1.3 million maritime vessels monthly and runs automated vessel detection on satellite imagery with commercial imagery tasking for evidence; EarthRanger (React Native) tracks 13,000 animals, supports 48,000 personnel, and ingests billions of satellite, sensor and field points into real‑time maps. Both use Mapbox vector tiles served on demand from ElasticSearch, register dynamic SVG icons client‑side, persist offline in SQLite, and handle millions of sensor features at interactive frame rates — vector tiles are the greatest thing ever, dynamic SVG symbology, near‑real‑time satellite ingestion.
AI-written summary · about
chapters (9)
- 0:00Introduction and setup
- 1:44AI2 and Skylight overview
- 3:11Mapbox tools in Skylight
- 6:50Satellite data integration
- 7:51Earth Ranger mobile app
- 9:18Custom symbology in React Native
- 13:51Dynamic icon challenges
- 15:59Live mobile app demo
- 19:10Q&A session
related talks
 18mPANEL: Space Is Closer Than You Think: Tech That's Changing Earth Today
 15mGraphs on the High Seas: UI/UX Considerations for Great Geospatial Graph Visualization
 49mSaving the world with JavaScript: A Data Visualization story
 20mBuilding maps with Impact on React and the Jamstack
 44mMaps & Data
 15mMaking maps work on mobile
 31mFlying Satellites from a Browser
 24mMaps, Data, and Charts - Bound for Great Things!