Cycle Time is the only metric that counts

summary
Claim: focus on cycle time as the leading metric, not ceremonies. Teams use Excel + Jira add-on and ChatGBT to generate cycle time scatter plots, find 85% of work at 25 days, then run a one-day “big refinement” and two-day flow workshop to enforce 7 days or less story slicing. Within four weeks typical cycle time drops from 25 to ~9 days, but bugs rise to ~30%, teams build a custom feature toggles solution in three weeks and discover gaming and throughput instability.
AI-written summary · about
chapters (16)
- 0:00Cycle time as key metric
- 1:10Constant next sprint trap
- 3:17Maturity assessments don't focus teams
- 4:00Cycle time scatter plots
- 6:06Big batches hurt flow
- 7:10Big refinement pizza party
- 8:54Slicing stories to seven days
- 10:20Two-day flow workshop
- 11:26Cycle time reduced from 25 to 9 days
- 13:10Draining the pool reveals problems
- 14:38Calendar vs working days gaming
- 15:42Context in cycle time data
- 16:23Quality trap and safety risks
- 17:28Learning over metrics
- 18:11Getting started with cycle time
- 19:19Q&A on splitting tasks
related talks
 51mThe astonishing value of speed
 20mHow to Communicate Metrics to Build Engagement
 23mBeyond Jira: Decode that Control Chart
 44mPredictably Agile
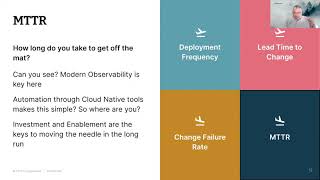 14mI don't think these metrics mean what you think they mean!
 44mEnhancing the Performance of Engineering Teams
 36mThe Development Metrics You Should Use (but Don’t)
 41mThe Development Metrics You Should Use (but Don’t)