The State of OpenTelemetry

summary
OpenTelemetry ships as a vendor-neutral stack where tracing stable is production ready, metrics feature freeze is imminent and logs draft remains experimental. Java gets strong auto-instrumentation via a runtime Java agent; some business attributes still need manual spans. Best practice routes telemetry through an OpenTelemetry Collector so only one exporter must be swapped. Demo shows frontend → anti‑fraud → checkout with Postgres, visible latency spikes, higher failure rates in the fraud service and service maps for root‑cause work.
AI-written summary · about
chapters (10)
- 0:00Start
- 7:33Traces Application Performance Monitoring Distributed Tracing
- 8:21the monitoring and management of performance and availability of software applications. Wikipedia
- 9:03Better Times for Vendors
- 10:16Goals Transaction context Reconstruct flow Query & visualize transactions
- 12:10Span Context: IDing a request Context Propagation: Attaching IDs
- 16:59W3C Trace Context Pass trace context information across systems
- 19:44Status Tracing: stable Metrics: stable / feature-freeze Logs: draft https:/opentelemetry.io/status
- 29:37Options? Features: Elastic APM Central config management Error reports Profiling capabilities
- 37:21Distributed Tracing Why & how
related talks
 46mThe State of OpenTelemetry
 22mOpenTelemetry – An Observability Framework for Cloud-Native Software
 35mOpenTelemetry for Busy People
 50mGuide to Observability with OpenTelemetry
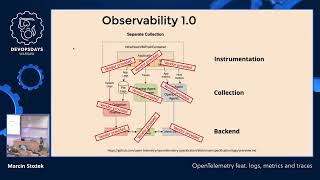 32mOpenTelemetry feat. logs, metrics and traces
 30mOpenTelemetry: The Road Ahead + Meet the Co...
 36mObservability For You and Me with OpenTelemetry
 50mBootiful OpenTelemetry