From Running to Operating: Real-World Strimzi in Production

summary
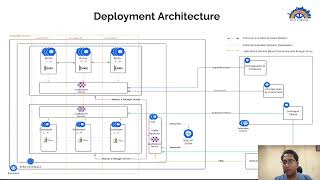
Runs Strimzi-backed Kafka as the core of an observability pipeline, classifying topics so replication factor, acks, partitions, retention and cleanup match data importance; implements a custom OpenTelemetry receiver and processors to collect JMX/Kafka metrics and enrich consumer offsets with Kubernetes pod metadata. Monitors five leading metrics (under‑replicated partitions, offline partitions, broker headroom %, active controller, bytes in/out) plus JVM, GC, PV usage and consumer lag; performs parallel cluster migration (0.36 → 0.45 → 0.46 → 1.0 CR change) to upgrade with minimal downtime.
AI-written summary · about
chapters (13)
- 0:00Introduction
- 1:02Randoli observability platform
- 3:06Why Strimzi is critical to our platform
- 3:49Kafka architecture priorities
- 7:25Monitoring Kafka with OpenTelemetry
- 10:19Key production metrics
- 13:52JVM and resource monitoring
- 14:13Slow consumers and rebalancing
- 15:56Consumer lag debugging
- 19:03Processing latencies and errors
- 20:29Log monitoring importance
- 21:10Upgrade challenges
- 27:06Q&A
related talks
 19mStrimzi & OpenTelemetry: Building End-to-End Observability for Kafka on Kubernetes
 34mHow to Survive Managing Strimzi in an Enterprise
 42mTransition to Apache Kafka on Kubernetes With Strimzi
 31mSimplifying Apache Kafka on Kubernetes With Strimzi
 26mProduction Grade Kafka on K8s
 29mMastering Kafka Workload Balancing With Strimzi’s Cruise Control Integration
 32mStretching Strimzi: Exploring Multi-Cluster Kafka for High Availability
 33mManaging a Kafka cluster in KRaft mode with Strimzi