Ruby Objects: A Walkabout

summary
Uses the TracePoint API to count runtime events and produce JSON summaries via a small Rack middleware; a tiny Rack app instantiates 1 class, 1 method and 1 dispatch, a Sinatra hello world creates 43 classes, 155 methods and 548 dispatched calls, and a minimal Rails example shows 361 classes, ~1,200 methods and ~8,600 dispatches. Uses the ObjectSpace API and the allocation_tracer gem to measure rough memsize, flagging a line that allocates 10,004 objects and a multi-assignment that creates 5,000 arrays until the code is rewritten.
AI-written summary · about
chapters (8)
- 0:00Introduction
- 2:35About the speaker
- 5:58TracePoint overview
- 9:45TracePoint in practice
- 15:16ObjectSpace analysis
- 16:47Memory profiling
- 19:57Allocation tracer
- 27:06Conclusion
related talks
 27mNew Ruby 2.1 Awesomeness: Pro Object Allocation Tracing
 53mRuby.inspect
 37mWhat’s happening in your Rails app? Introduction to Introspection features of Ruby
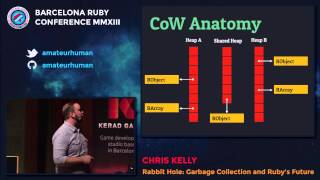 49mRabbit Hole: Garbage Collection and Ruby's Future
 38mPractical Debugging
 42mDebugging Ruby
 41mSpeed up Rails, Speed up Your Code
 37mThe Future of Ruby Performance Tooling