Transforming Data to Unlock Its Latent Value
summary
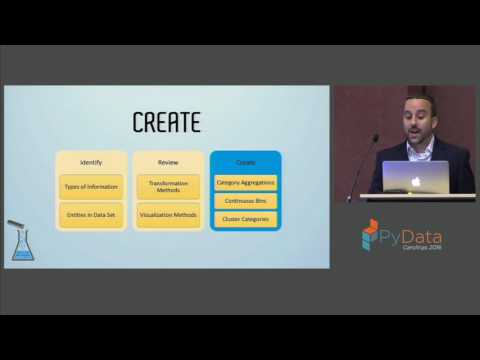
A repeatable EDA framework claims to turn messy tables into actionable views by a prep phase (identify entity hierarchy, create derived categories, bin quintiles) and an explore phase (filter, aggregate, pivot, visualize, graph). It runs on the EPA fuel economy dataset, uses Pandas, Scikit-Learn, Seaborn, Yellowbrick, and applies clustering (start ~8–10 then reduce to clustering to 4 groups) to create features, scatter‑matrices with cluster overlays, pivot heatmaps, ego graphs and network community detection that reveal concrete findings (BMW has most models, SUVs rise since late 90s) and generates usable insights.
AI-written summary · about
chapters (14)
- 0:00Data transformation framework
- 1:06Speaker background
- 2:32Data and cognition
- 4:15Two-phase exploration
- 5:59Data types and entities
- 8:29Transformation methods
- 11:17Categorical fields
- 16:55Filtering and aggregation
- 19:01Pivot tables
- 21:29Time-based trends
- 23:16Scatter matrices
- 25:22Graph analysis
- 29:36Framework recap
- 31:03Q&A
related talks
 32mData Transformation: A Framework for Exploratory Data Analysis
 32mEDA Techniques for Data Analysis
 24mThe TL;DR of EDA
 01h 51mData Visualization and Exploration with Python
 01h 38mEffective Data Visualization
 57mVisualization Tools for Data Discovery
 30mBe kind to yourself! Spend (less) time on Data Exploration
 47mData Wrangling: Getting Started Working with Data for Visualizations