Fun and Games: Using Prometheus to aggregate disparate metric dat...

summary
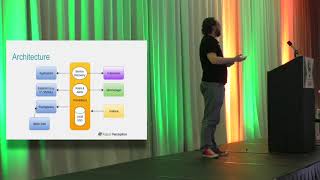
A gaming company centralizes load test metrics coming from Prometheus, DataDog, Graphite, Zabbix, New Relic and StatsD by collecting key observability metrics and pushing them into Prometheus + Promscale backed by TimescaleDB. The engineered pipeline supports backfill legacy data, both push and pull ingestion, and enables queries in SQL and PromQL. The result is a single long‑term store that powers self‑serve dashboards, on‑demand reports and cross‑team analysis for load testing.
AI-written summary · about
chapters (13)
- 0:00Intro
- 0:10Meet Mat
- 1:05Use Case
- 1:39Load Testing
- 2:07The Problem
- 2:27The Architecture
- 3:38Benefits
- 4:06Why Prometheus
- 4:55Why Prometheus Scale
- 6:08Why this is a good use case
- 6:19What is flexibility
- 7:02Why would you want to do this
- 8:07Resources
related talks
 48mMetrics All the Way: Data Driven Operations
 10mPrometheus for Monitoring Metrics - Database Monitoring Tools
 27mObservability with Prometheus and beyond
 40mThe Prometheus monitoring system
 32mDemocratizing Application Monitoring with Prometheus
 36mObservability with Prometheus and Beyond: Leveraging Cloud-native Technologies Outside of Cloud
 46mPrometheus as a Time Series Database
 30mIntro: Prometheus