Open Telemetry: The Rise of Open Standards in Observability
summary
OpenTelemetry claims to make telemetry interoperable by standardizing APIs, SDKs and a binary OTLP gRPC protocol so collectors can transform and route traces metrics and logs to any backend. A live Kubernetes demo uses a GitHub repo and shows a feature flag flipping that produces a spike in errors which Grafana dashboards and Jaeger traces attribute to the get product service. Prometheus-style metrics supply golden signal counts and the demo successfully reproduces and diagnoses the failure.
AI-written summary · about
chapters (13)
- 0:00Introduction
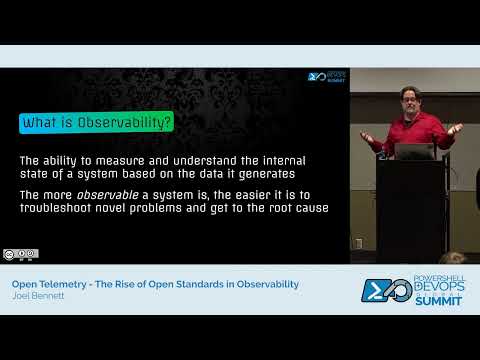
- 2:22What observability means
- 4:49History of observability tools
- 7:18Birth of OpenTelemetry
- 9:52Observability and telemetry signals
- 13:00Three monitoring approaches
- 17:55Live OpenTelemetry demo
- 28:26OpenTelemetry as cross-cutting concern
- 31:57OpenTelemetry standards
- 34:06OTLP explained
- 40:26Semantic conventions
- 43:42Demo architecture
- 46:40Q&A
related talks
 34mOpenTelemetry: The Vision, Reality, and How to Get Started
 30mOpenTelemetry 101
 20mObservability and Open Telemetry
 35mOpenTelemetry for Busy People
 34mKubernetes Observability with OpenTelemetry
 22mOpenTelemetry – An Observability Framework for Cloud-Native Software
 18mOpenTelemetry and Observability: What, Why, and Why Now?
 43mWhat is this OpenTelemetry thing?