How I learned to stop worrying and love UX metrics
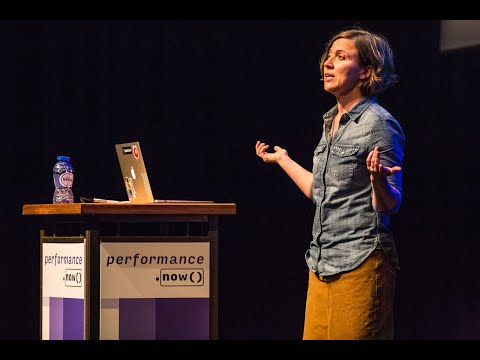
summary
Argues there is no single “unicorn” metric and demonstrates concrete options, using SpeedCurve, WebPageTest, synthetic and RUM data, Lighthouse and custom UserTiming marks. Shows surprising correlations (BBC ~10% user loss per extra second, Ancestry +7% conversion after a 64% load improvement) and cross‑site checks (many first paints happen before start render). Recommends visual sanity checks with filmstrips, start render, speed index, and site‑specific hero rendering times plus performance budgets and custom timers.
AI-written summary · about
chapters (4)
- 0:00Start
- 13:46amazon start render repeat visits
- 19:52An analysis of Chromium's paint timing metrics
- 31:54First Click First Scroll First Key First Input Delay
related talks
 36mHunting the Unicorn
 05mMeasuring what matters
 36mMoneyball for Performance Metrics
 29mWeb Performance Kinetosis
 18mWebsite performance from user perspective
 57mAn Opinionated Guide to Web Performance Budgets
 35mWeb Application Performance Testing from Users Perspective
 48mThink Fast, First: Empowering a Performance Culture