Anthony Bak, Principal Data Scientist and Mathematician, Ayasdi

summary
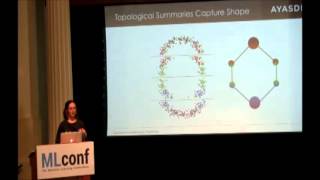
Ayasdi’s pipeline builds combinatorial summaries (Mapper-style graphs) from real-valued lens functions to reveal shape in high‑dimensional data, not just labels. The method eats PCA, density, autoencoders etc., is coordinate- and deformation‑invariant and robust to noise, and compresses spaces into easy graphs. A healthcare case uses 10,000 points 40,000 features to find a cohort of doctors that an ensemble of anomaly models all flag, exposing a shared model bias rather than true fraud. The approach is practical and diagnostic.
AI-written summary · about
chapters (11)
- 0:00Intro
- 1:56Solution: Topological Summaries
- 3:32Shape as Organizing Principle
- 7:56Reduce Bias, Discover Models
- 9:08Generating Topological Summaries AYASDI
- 13:17Lenses: where do they come from? AYASDI
- 16:02Key Properties of TDA
- 18:11Coordinate Invariance: Gene Expression AYASDI
- 19:07Deformation Invariance
- 20:40Compressed Representation
- 22:07Model Introspection
related talks
 28mAnthony Bak, Principal Data Scientist at Ayasdi @ MLconf SEA
 20mAllison Gilmore, Data Scientist, Ayasdi
 20mAllison Gilmore, Data Scientist, Ayasdi
 06mComplex Data Analysis
 01h 00mData, visualization, and designing AI
 50mThe Shape of Data: Machine Learning and Topology
 01h 38mEffective Data Visualization
 24mAshfaq Munshi, ML7 Fellow, Pepperdata