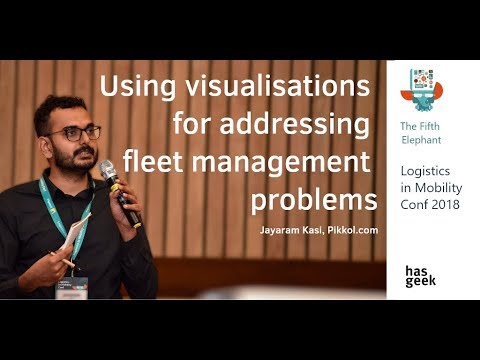
Using visualisations for addressing fleet management problems
summary
Fleet matching for LTL loads uses interactive maps built with D3 plus a voice layer via Dialogflow and code on GitHub to turn user clicks into heuristics and later optimised algorithms. Visual encodings use pre‑attentive attributes—position for lat/long, two‑color go/no‑go and line thickness for aggregation—to expose when loads can couple. Simulations assume Poisson arrivals to forecast channel volume; result: visible routing choices drive higher matched volume and lower cost per shipment while enabling automated scheduling and pricing.
AI-written summary · about
chapters (8)
- 0:00Visual problem-solving in fleet management
- 1:23Pre-attentive attributes in visualizations
- 3:33Design choices as UX challenges
- 3:55Freight matching at Pickall.com
- 8:38Iterative visualization development
- 10:27Visual insights to optimization
- 11:11Results on cost and revenue
- 11:45Q&A
related talks
 15mGraphs on the High Seas: UI/UX Considerations for Great Geospatial Graph Visualization
 25mVisualizing the journey: Using data and design to transform event travel with Viata
 30mCreate Detailed Traffic Models and Simulations
 25mCurrent and Future Trends in Mapping
 16mTidy Transit: Real Life Data Modeling for Public Transportation
 13mConnecting data sources with AI
 37mVisualizing Large Datasets with JavaScript Using deck.gl
 21mLinked Visualisations via Galois Dependencies