Java Memory Management Best Practices

summary
Java defaults give a max heap of a quarter of physical RAM and often surprise; set -Xmx explicitly, use jcmd to take heap dumps (beware health checks and storage), analyze dumps with Eclipse Memory Analyzer or Microsoft GC Toolkit, and profile native allocations with async-profiler or JNM tracking. Recent JDKs (24/25) add compact object headers; metaspace should be bounded to catch leaks; direct buffers count against native memory; string deduplication has a default threshold of three; GC overhead limit triggers at 98%.
AI-written summary · about
chapters (9)
- 0:00Introduction
- 1:20Memory basics and constraints
- 4:49JVM memory configuration
- 11:26Optimizing JVM environment
- 18:01Heap dump analysis
- 23:56Advanced memory optimizations
- 28:46Native memory and code cache
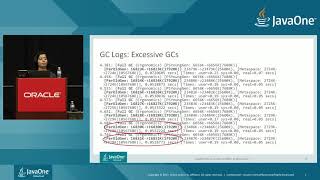
- 34:06GC throughput and logging
- 38:54Strings, collections, and closing
related talks
 43mTroubleshooting Memory Problems in Java Applications
 32mMastering JVM Memory Troubleshooting - From OutOfMemoryErrors to Leaks
 51mJava 10/11 Memory Management and GC
 45mScooby RAM, where are you?
 34mTroubleshooting Native Memory Issues in Java Applications
 52mMemory footprint of a Java process
 01h 32mBuilding and Tuning High Performance Java Platforms
 52m-XX:+UseG1GC