Introduction to Spring Boot Application monitoring

summary
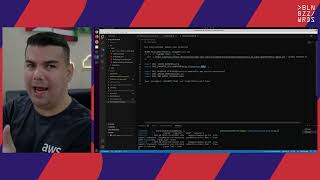
Practical walkthrough of instrumenting a Spring Boot service using Micrometer to expose metrics via Actuator, scraped by Prometheus, routed through Alertmanager and visualized in Grafana. Demo runs a microservice with Redis and a JMeter load (4 concurrent users → ~20 req/s, ~25% failures, expected 200 ms average) using redis_exporter, imported prebuilt Grafana dashboards, and verified JMX values in JConsole. Alerts and silence/grouping behavior are configured in Alertmanager.
AI-written summary · about
chapters (21)
- 0:00Introduction
- 5:00Presentation
- 9:05Monitoring definition
- 9:52Why should developers monitor
- 11:34Monitoring ecosystem
- 15:16Metrics
- 16:34Binders
- 19:06Prometheus Server
- 22:09Alert Manager
- 24:24Grafana
- 25:07Demo
- 30:59Metric endpoints
- 34:27Prompt use
- 35:29Redis exporter
- 37:19Graphana dashboard
- 41:54JConsole
- 43:29Conclusion
- 45:40Alerts Manager
- 49:06Methodology
- 51:58Dashboard
- 53:58Project setup
related talks
 41mMonitoring Like a Boss
 46mImplementing Observability in Java-Based Projects
 57mIntroducing Micrometer Application Metrics
 40mMonitoring Spring Boot Applications with Spring Boot Admin
 34mPrometheus for Devs
 44mDo It Yourself: Programmable Metrics using OpenTelemetry
 52mIs your JVM app flying blind? Unmask hidden issues with Observability superpowers!
 55mBootiful Spring Boot 3