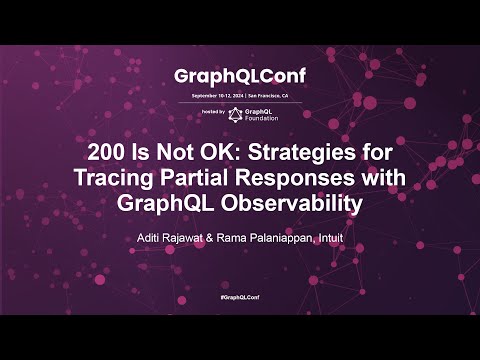
200 Is Not OK: Strategies for Tracing Partial Responses w/ GraphQL
summary
Intuit runs a Federated GraphQL gateway in production for two years handling billions of requests and shows that 200 is not always OK: GraphQL 2xx responses can contain server-side errors from subgraphs. They instrument GraphQL Java/DGS to classify client vs server errors, emit a server-error signal alongside HTTP code, propagate a transaction ID header, and collect metrics, logs and OpenTelemetry traces into dashboards that stitch spans to reduce MTTD and MTTR.
AI-written summary · about
chapters (9)
- 0:00Introduction and agenda
- 2:34Why 200 is not always OK
- 6:47Partial responses in GraphQL
- 11:43Demo of partial response issue
- 15:03Logging strategies for GraphQL
- 16:50Demo of logging dashboard
- 20:24Distributed tracing for GraphQL
- 23:41Demo of tracing visualization
- 27:12Q&A on observability trade-offs
related talks
 21m200 NOT OK: High-Resolution Observability
 18mWhat Could Go Wrong with a GraphQL Query and Can OpenTelemetry Help?
 26mBeyond HTTP 200: Observability With GraphQL
 32mTesting GraphQL APIs
 26mWhen GraphQL Gets Expensive: Performance & Cost Patterns in Production Serverless Architectures
 24mA GraphQL Survival Kit
 01h 07mGraphQL: Smooth Schemas and Rough Edges
 27mWhy Your GraphQL APIs Are Increasingly Under Attack