How to Monitor Your Commute with Grafana

summary
Built with Grafana and live feeds, a commuter dashboard aggregates real-time bus locations (lat/long points that animate on the map), freeway congestion metrics, weather, and streaming video from city traffic cameras so commute time swings of ~25 to 60 minutes become visible at a glance. It pulls public transit vehicle GPS, shows moving dots on panels, uses live congestion metrics to compare driving versus taking train or bus, and works reliably enough to win community votes and a Golden Grot award.
AI-written summary · about
related talks
 10mSmart Commuting
 16mTidy Transit: Real Life Data Modeling for Public Transportation
 25mMap transit systems on transportation networks using GTFS Data and Infomap
 11mUrban Computing
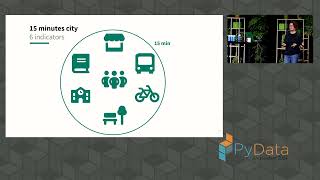 40mHow to measure a city
 14mTelling Traces
 36mVisualization of Your Distributed Infrastructure
 13mReimagining Public Transport: An OSM-based Street Supply Tool