Watch Everything, Watch Anything: Anomaly Detection
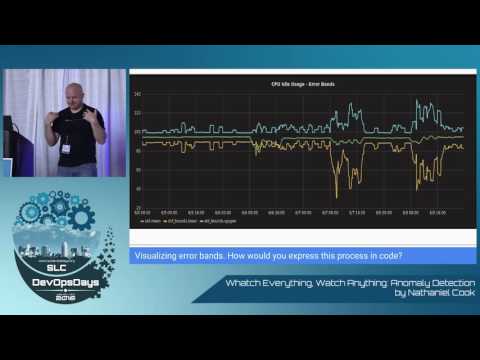
summary
Claims a practical anomaly workflow: push metrics with Telegraf into InfluxDB, run Kapacitor tasks that compute mean and standard deviation or apply Holt Winters predictions or the morgoth frequency model, compare with concrete thresholds (3.5σ, 20% error), and replay 180 days of data to measure false positives/negatives and detection delay. Example: predict disk growth to avoid useless 70% alerts. Empirical tuning targets fewer than ~10 actionable alerts per engineer per day and lets teams iterate until the detector actually catches past outages.
AI-written summary · about
chapters (11)
- 0:00Start
- 1:49in DevOps we are good at collecting metrics
- 3:02The Problem - Scalability
- 7:34Machine Learning 101
- 8:51Standard Deviation Model
- 16:50Predictive Model
- 20:44Custom Model
- 23:57How do you pick a model?
- 25:06Properties of an Anomaly Detection Method
- 28:27Kapacitor makes this easy
- 31:23Try it out
related talks
 35mObservability’s Sixth Sense: Detecting Anomalies in Metrics
 31mFirst Day Foresight: Anomaly Detection for Observability
 40mObservability’s Sixth Sense: Detecting Anomalies in Metrics
 35mAnomaly Detection for Cloud Native Storage
 26mAnomaly Detection System for the CERN Cloud
 34mAnomaly Detection in Time Series from Scratch Using...
 29mAlerting and Anomaly Detection – Best Friends Forever?
 19mThe Rise of AI in Anomaly Detection