bpftrace: what is it, what's new, and where is it going

summary
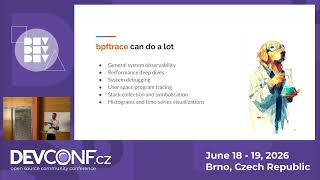
A lightweight CLI language that compiles to eBPF, bpftrace runs live kernel and user‑space probes with far less code — the execsnoop example shows a one‑line bpftrace equivalent versus ~363 lines in BCC and hundreds more in raw libbpf C. New features include ahead-of-time compilation, loop over map elements, and a config block that improves portability. Used at Meta to find page‑fault long tails and track dlopen usage, upcoming work targets C++/Python type support, raw bpf program interop, more map types, embedding in binaries, and structured trace output for visualization.
AI-written summary · about
chapters (12)
- 0:00bpftrace intro
- 1:03What is bpftrace
- 3:38bpftrace vs raw BPF
- 4:22Limitations and strengths of bpftrace
- 5:25How Meta uses bpftrace in production
- 7:10New bpftrace features
- 9:17bpftrace future
- 10:21Embed bpftrace in binaries
- 11:04bpftrace documentation and resources
- 13:36Visualize bpftrace output
- 15:04Contribute to bpftrace
- 16:10Q&A
related talks
 25mAn introduction to bpftrace tracing language
 35mbpftrace: Evolution from a command line tool to a complex observability framework
 38mLinux Kernel Tracing Using eBPF
 25mKernel tracing with BPF
 46mbpftrace internals
 38mThe Next Linux Superpower: eBPF Primer
 34mWhat's new in the BPF world?
 32meBPF: BPF kernel infrastructure