Vis.gl, the powerful framework suite for geospatial visualization

summary
Vis.gl is a composable open source suite centered on deck.gl that runs geospatial compute on the client GPU, not the backend, and sees roughly 100K daily npm downloads with enterprise adopters like Uber, Foursquare, CARTO, Google and Amazon. The stack includes deck.gl + loaders.gl + kepler.gl, has GPU-powered client-side compute that reaggregates at 60fps and handles 1M+ rows in the browser, supports 3D tiles (Google photorealistic 3D for 2000+ cities), Python/React bindings, PMTiles/cloud-native formats and WebGPU migration.
AI-written summary · about
chapters (21)
- 0:00Introduction and motivation
- 1:09GPU power for geospatial visualization
- 2:36Vis.gl framework ecosystem overview
- 4:24Deck.gl core framework deep dive
- 6:58Views and transitions in Deck.gl
- 8:25Handling large datasets with tiling
- 10:14GPU-accelerated data aggregation
- 11:42Loaders.gl for data ingestion
- 13:273D tiles and advanced formats
- 15:35Base map integrations
- 17:01Add-on frameworks Flowmap GL and Nebula
- 18:46H3.js for video generation
- 20:15Community and governance
- 22:49Recent year highlights
- 24:14Terrain and label collision features
- 25:39Clipping and advanced rendering
- 27:48Future of WebGPU and interoperability
- 30:59New widgets and theming
- 32:44Cloud-native geospatial formats
- 34:54Open governance and commercial use
- 36:19Demo and closing
related talks
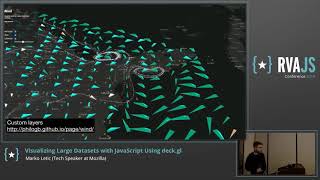 37mVisualizing Large Datasets with JavaScript Using deck.gl
 40mVisualizing Large Datasets with JavaScript Using Deck.gl
 30mVisualizing Success: Year One of the OpenVis Collaboration Space
 49mSaving the world with JavaScript: A Data Visualization story
 24mMaps, Data, and Charts - Bound for Great Things!
 36mMaking interactive visualizations easy, inside and outside of notebooks
 31mLessons Learnt Visualising Real-World Cities in 3D
 02h 02mInteractive 3D Web Mapping