Hands-on guide to monitor your API-driven AI/LLM applications

summary
Hands-on demo of New Relic’s AI Monitoring shows a Flask app calling GitHub-hosted LLMs instrumented with the New Relic Python agent, capturing tokens, latency and traces, request/response text, errors and trace IDs. Dashboard compares models: GPT‑4o mini vs Mistral (GPT uses ~35% fewer completion tokens; Mistral is ~1% faster), surfaces costly callers, and lets teams mask PII with masking and drop filters. Lab provisions live environment, works in a free trial, and includes a beta LLM evaluation for custom quality thresholds.
AI-written summary · about
chapters (15)
- 0:00AI monitoring challenges
- 1:54Top three challenges
- 4:00AI telemetry complexity
- 6:28AI response quality
- 7:11Model cost and token usage
- 7:54Security and compliance
- 8:57Lab setup and GitHub token
- 14:39New Relic for AI observability
- 22:04AI responses in New Relic
- 28:13Model performance with traces
- 34:03Switching models comparison
- 39:04AI monitoring dashboard
- 40:32Model metrics comparison
- 43:40Custom dashboards
- 45:53Lab access and Q&A
related talks
 07mUnderstanding AI performance and cost management with New Relic
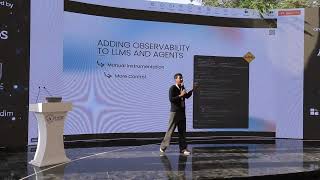 16mWhat Did the AI Just Do?: Making LLMs Observable with Open Telemetry
 49mNext-Gen Documentation with AI
- 49mNext-Gen Documentation with AI
 29mYour Prompt Is Not a Unit Test — instrumenting LLM apps in production
 38mAI Monitoring Mastery: Optimize Performance, Ensure Compliance, and Cut Costs
 23mFrom Hallucinations To Hardware: Diagnosing LLM Failures
 41mBuilding LLM Agents – Challenges and Learnings