gRPC Observability: A Guide To Distributed Debugging and Monitoring

summary
gRPC adds concrete observability: OpenTelemetry tracing is implemented in Java, Go and C++ (experimental), with per-attempt vs per-call semantics to separate client retries from server requests. C++ on Linux offers TCP-level instrumentation exposing send/ack timestamps, delivery rate, min RTT and retransmissions. New metrics include retries/hedges, WRR weights, XDS state, richer subchannel errors, an optional backend_service label and outlier detection. Complementary tools: binary logging with RPC replay, gcurl, channelz/CSDS and grpc_debug, plus a latency profiler output for perf tools.
AI-written summary · about
chapters (15)
- 0:00gRPC observability intro
- 1:03gRPC + OpenTelemetry
- 4:36TCP tracing in C++
- 5:41gRPC metrics basics
- 7:28Retry and hedging metrics
- 8:09WRR load balancing metrics
- 8:52XDS discovery metrics
- 9:33Subchannel connection metrics
- 10:17Outlier detection labels
- 11:19TCP metrics for debugging
- 12:24gRPC binary logging
- 13:50gRPCurl testing
- 15:11Channelz monitoring
- 16:56gRPC debug CLI
- 18:21Future observability roadmap
related talks
 22mWhat's New With gRPC's Observability?
 29mWhat's new in gRPC Observability
 32mUnified Observability in GRPC: Metrics and Tracing Using OpenTelemetry Plugin
 30mMastering Distributed Tracing with Go
 33mgRPC For Microservices: Service-mesh and Observability
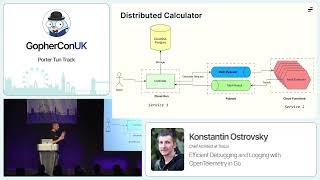 39mEfficient Debugging and Logging with OpenTelemetry in Go
 30mOpenTelemetry 101
 55mCloud-Native Observability with OpenTelemetry